A Cleaner Way to Research Real Estate Markets
[Link] TractVue: https://www.tractvue.com
Building TractVue: A Cleaner Way to Research Real Estate Markets
Most real estate research still happens the hard way -> a dozen browser tabs, a Zillow search here, a Census table there, a half-remembered mortgage calculator, and a spreadsheet trying to hold it all together. I wanted something better: one clean workspace where you can see a market, run the numbers, and ask questions without wrestling with scattered data sources.
That’s TractVue, a real estate research tool that brings market data, affordability insights, and deal analytics into one place. It’s built for investors, realtors, and curious homeowners who want to understand a market before they commit.
Right now TractVue ships with two focused areas: Research and Calculator. Here’s a tour of each, and a bit about how they work under the hood.
1. Research: A Map That Actually Tells You Something
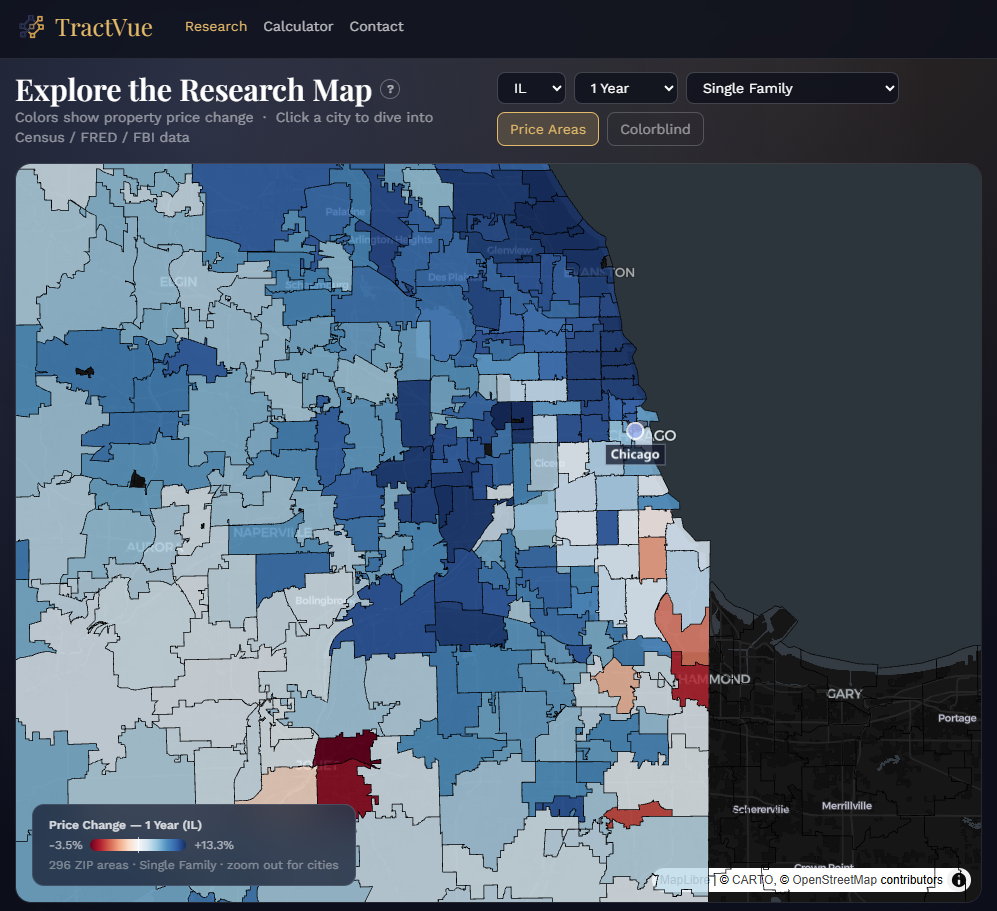
The heart of TractVue is the Research map. Instead of a list of listings, it’s an interactive choropleth that a map coloured by how home prices are actually changing, region by region, right down to the ZIP-code level.
A few things I focused on:
- Price change at a glance. Regions are shaded on a diverging red-to-blue scale. Red means decline, blue means growth, with a neutral midpoint anchored exactly at zero - so red only ever means prices fell. No ambiguity.
- Slice the data your way. Filter by time range (1, 3, 5, 10, or 20 years) and by property type - single family, condo/co-op, top/mid/bottom tier, or by bedroom count (2, 3, 4, 5+ bed).
- Zoom from country to ZIP. At the national level you see states and cities; zoom in and the map switches to ZIP-level (ZCTA) polygons where Zillow publishes them.
- Color-blind safe mode. There’s an alternate YlGnBu palette so the map stays readable for deuteranopia, protanopia, and tritanopia.
- School-district overlays. Composite school-district boundaries can be coloured by academic score, pulled straight from federal EDFacts data.
The neighborhood deep-dive
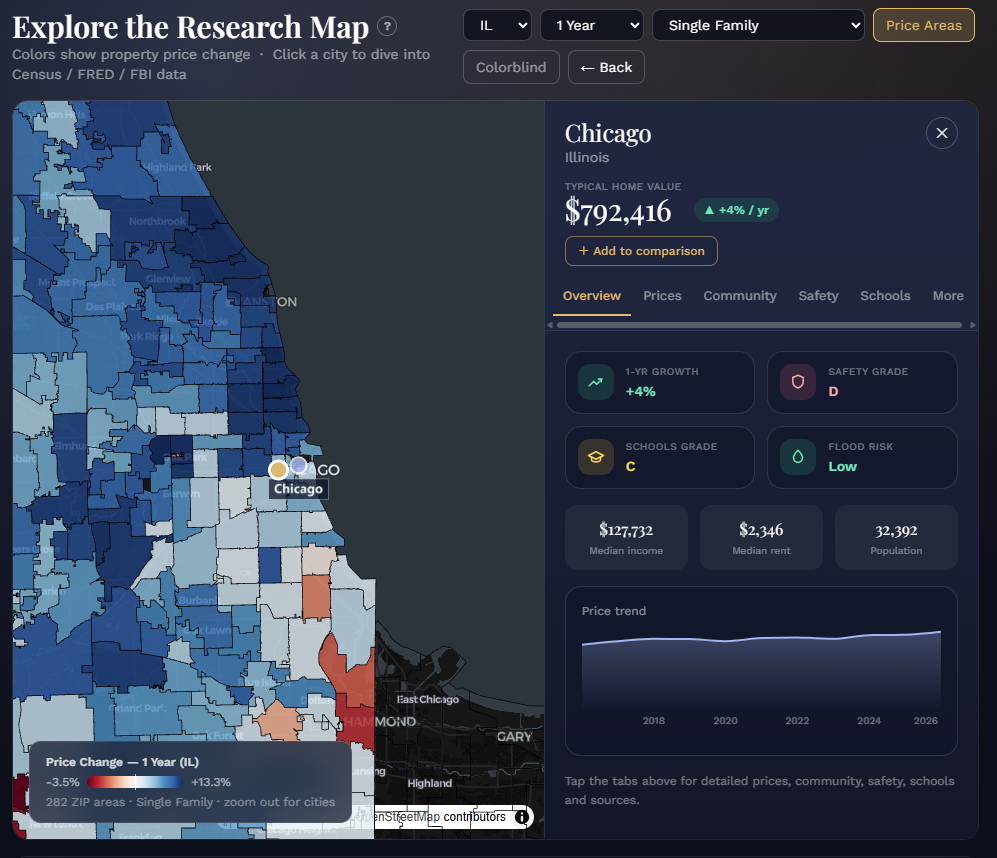
Click any place and a detail panel slides in with a tabbed breakdown:
- Overview - at-a-glance cards for 1-year growth, safety grade, schools grade, and flood risk, plus median income, rent, and population.
- Prices - macroeconomic context (mortgage rates, housing starts, building permits, CPI, unemployment) alongside the local Zillow price trend.
- Community, Safety, Schools - demographics, crime grades, and per-school ratings rolled into an area-wide grade.
- More - direct links to the underlying public sources.
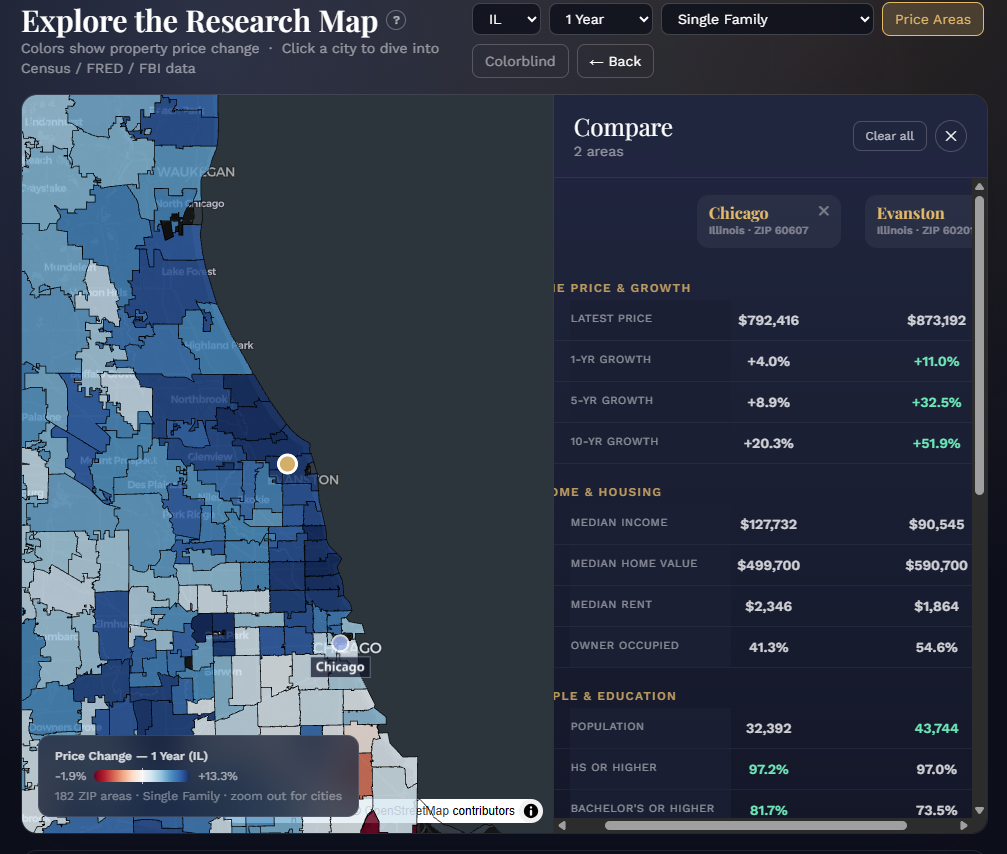
You can even add places to a comparison view to line up multiple markets side by side.
Where the data comes from
TractVue stitches together trusted public datasets:
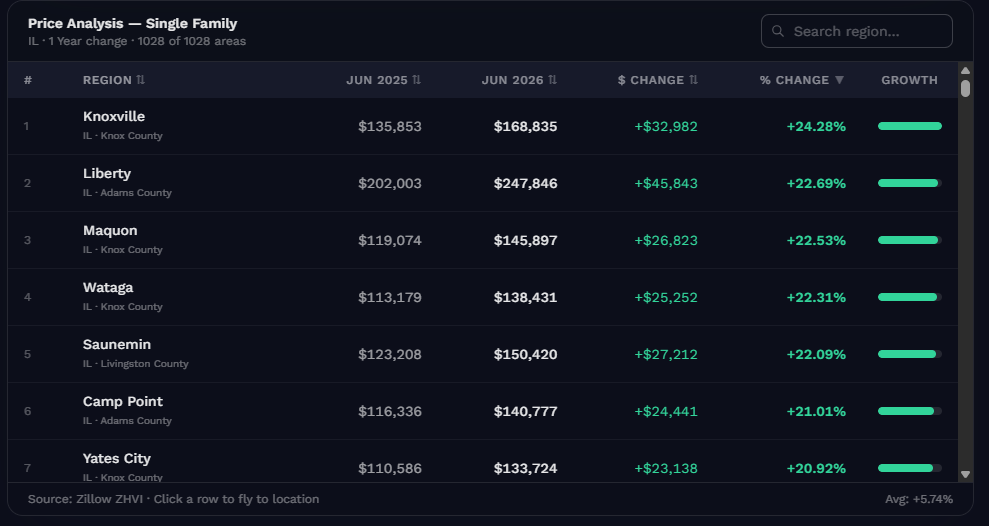
- Zillow Home Value Index (ZHVI) for home prices
- U.S. Census Bureau for demographics and place boundaries
- Federal Reserve Economic Data (FRED) for macroeconomic indicators
- FBI crime statistics for safety grades
- NCES / EDFacts for school-district scores
All figures are for research and informational purposes only — not financial or investment advice.
2. Calculator: Run the Deal in Real Time
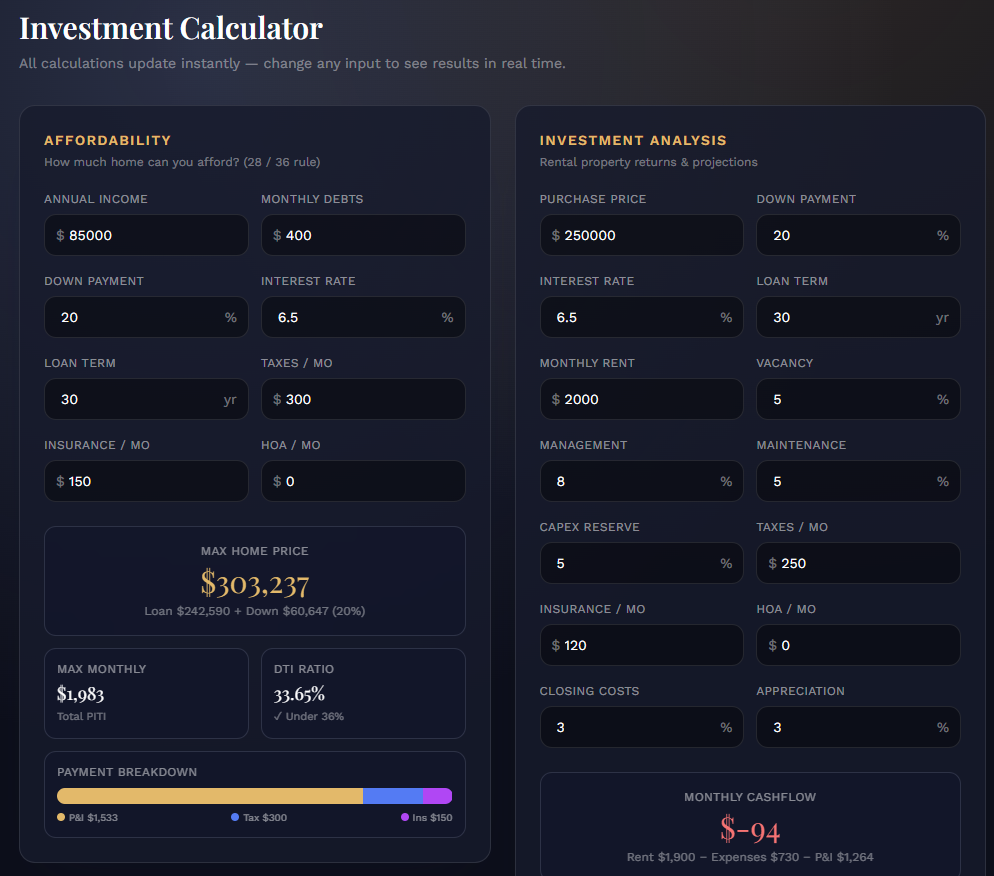
Seeing a market is half the job. The other half is knowing whether a specific deal works. TractVue’s Calculator page puts two tools side by side, and every result updates instantly as you type which no “Calculate” button required.
Affordability calculator
Answers the question: how much home can I actually afford? It uses the classic 28/36 rule and factors in:
- Annual income and monthly debts
- Down payment, interest rate, and loan term
- Taxes, insurance, and HOA
It returns your max home price, max monthly payment (full PITI), your debt-to-income ratio with a pass/fail flag, and a visual breakdown bar showing how each dollar of your payment splits between principal & interest, taxes, insurance, and HOA.
Investment calculator
For rental analysis, this one goes deep. Feed in purchase price, financing, rent, and operating assumptions (vacancy, management, maintenance, CapEx reserve, taxes, insurance, HOA, closing costs, appreciation, rent growth) and it computes:
- Monthly cash flow (clearly flagged green or red)
- Cap rate, cash-on-cash return, and an estimated IRR
- Break-even occupancy
- A 5-year projection table of property value, annual cash flow, and equity
Each metric comes with a quick sanity label - “Strong,” “Fair,” “Low” - so you don’t have to memorize what a good cap rate looks like.
3. Contact: Feedback That Shapes the Roadmap
TractVue is actively evolving, so the Contact page is intentionally simple. Pick a category which is general, bug, or feature and leave your name, email, and message, and it goes straight to my inbox. Client-side validation keeps out empty or malformed submissions, and there’s a clean success state once it sends.
Your feedback directly shapes what gets built next.
4. A Few Design Decisions I’m Happy With
- Map-first, not list-first. Real estate is inherently spatial. Leading with a map that encodes change makes patterns jump out that a table would bury.
- Zero-friction basemaps. The map just works out of the box - no API token required to get started.
- Honest color. Anchoring the diverging scale at zero and offering a color-blind-safe palette was a small amount of work for a big gain in trustworthiness.
What’s Next
The three tabs available today - Research, Calculator, and Contact - are the foundation. On the roadmap: saved searches and portfolios, deeper scenario modeling, and richer neighborhood analytics.
If you try TractVue and have thoughts, the Contact page is right there. I’d genuinely love to hear what markets you’re researching and what would make the tool more useful.
Thanks for reading and happy hunting.